Withinsites
Free Shopify Revenue Analysis

Find Out How Much Revenue Your Shopify Store Is Leaving on the Table

Get a personalized Ecommerce Revenue Score™ and discover exactly where conversion friction is costing you — before you spend another dollar on traffic.

  • A personalized report built specifically for your store
  • 12-point analysis across every revenue driver
  • An estimated annual revenue opportunity, in dollars

Industry benchmarks show the average Shopify store loses 20-30% of potential revenue to conversion friction — often $100K+ annually for stores doing $1M+ in sales

Get My Free Revenue Score
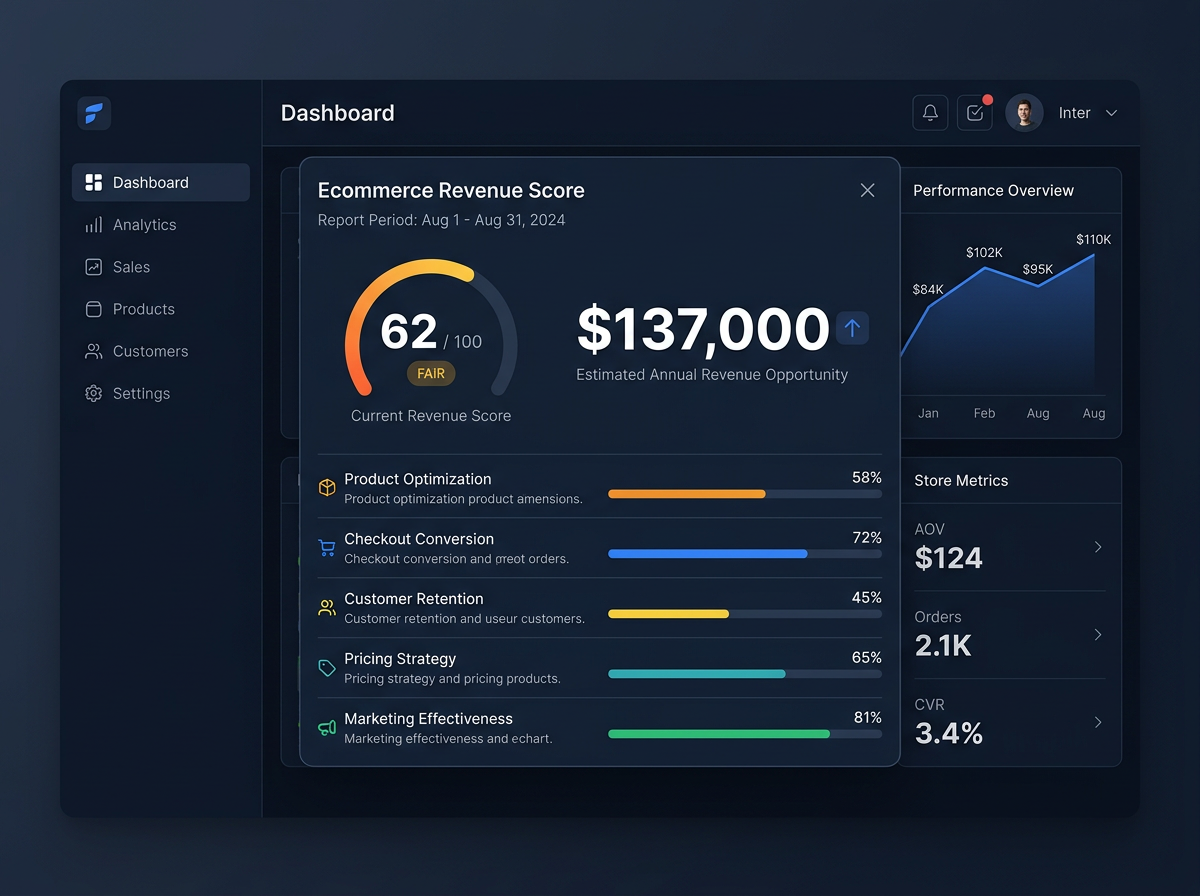
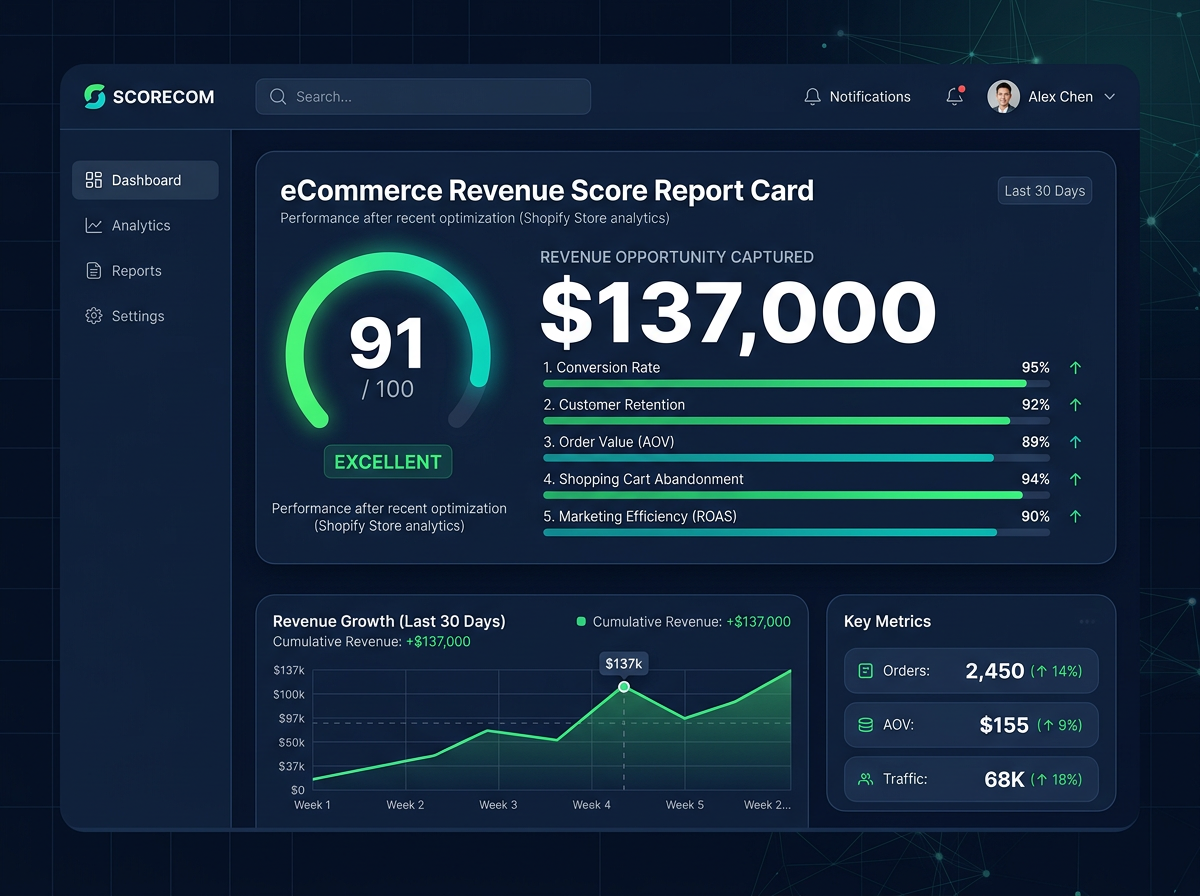
Ecommerce Revenue Score report mockup showing current score and $137,000 estimated annual revenue opportunity Improved revenue score report mockup after fixing gaps found in the audit Before Audit After Fixes
0-0%

Revenue Typically Left on the Table

+0%

Conversion Lift per 1s Faster Load

+0%

Avg. AOV Lift from Product Page Fixes

0

Hours in Every Deep-Dive Audit

Most Store Owners Are Pushing Traffic Through a Leaky Funnel

You're spending thousands on ads while revenue quietly disappears into cart abandonment, slow load times, weak product pages, and a clunky mobile experience. Without knowing where your biggest conversion leaks are, every marketing dollar you spend becomes less effective.

It's like having your best employee stuck on low-leverage busywork instead of the one thing that actually drives results. Every month you operate without this clarity is another month of compounding lost revenue.

The smartest operators get clarity on their highest-leverage opportunities first. That's exactly what your Revenue Score™ gives you.

What a Thorough Audit Typically Uncovers

Withinsites manages several large Shopify stores directly — our own optimization work has more than doubled revenue on stores we run. Here's what deep CRO analysis consistently finds industry-wide when best practices are applied.

Mobile Checkout Friction

Stores that streamline mobile checkout typically see conversion lifts of 15-25%, since mobile traffic often converts far below desktop when friction goes unaddressed.

Product Page Optimization

Rebuilding underperforming product pages with proven CRO frameworks commonly lifts average order value by 10-20% without any added ad spend.

Site Speed Improvements

Industry data shows every one-second improvement in load time can lift conversion by up to 7% — often recovered in weeks, not months.

Your Personalized Ecommerce Revenue Score™ Includes

12 critical areas we analyze to uncover your store's revenue potential — ordered from highest impact to supporting factors.

Checkout Friction

Where buyers hesitate and abandon right before paying you.

Product Pages

Whether your pages actually convince, or just describe.

Mobile Experience

Where most of your traffic lives, and often where it leaves.

Cart Abandonment

The recovery mechanisms that are missing or underperforming.

Site Speed

Every extra second of load time you're paying for in lost sales.

Homepage Effectiveness

Whether your homepage guides visitors toward purchase or confuses them.

Upsell Opportunities

Missed chances to increase order value from existing buyers.

Email Capture

How effectively you're turning visitors into a contactable list.

Retention

Whether customers come back, and what's stopping them if not.

Customer Experience

The overall journey from first click to post-purchase follow-up.

Trust Signals

Whether your store gives buyers enough confidence to click "buy."

SEO Fundamentals

Whether your store is set up to earn free, compounding traffic.

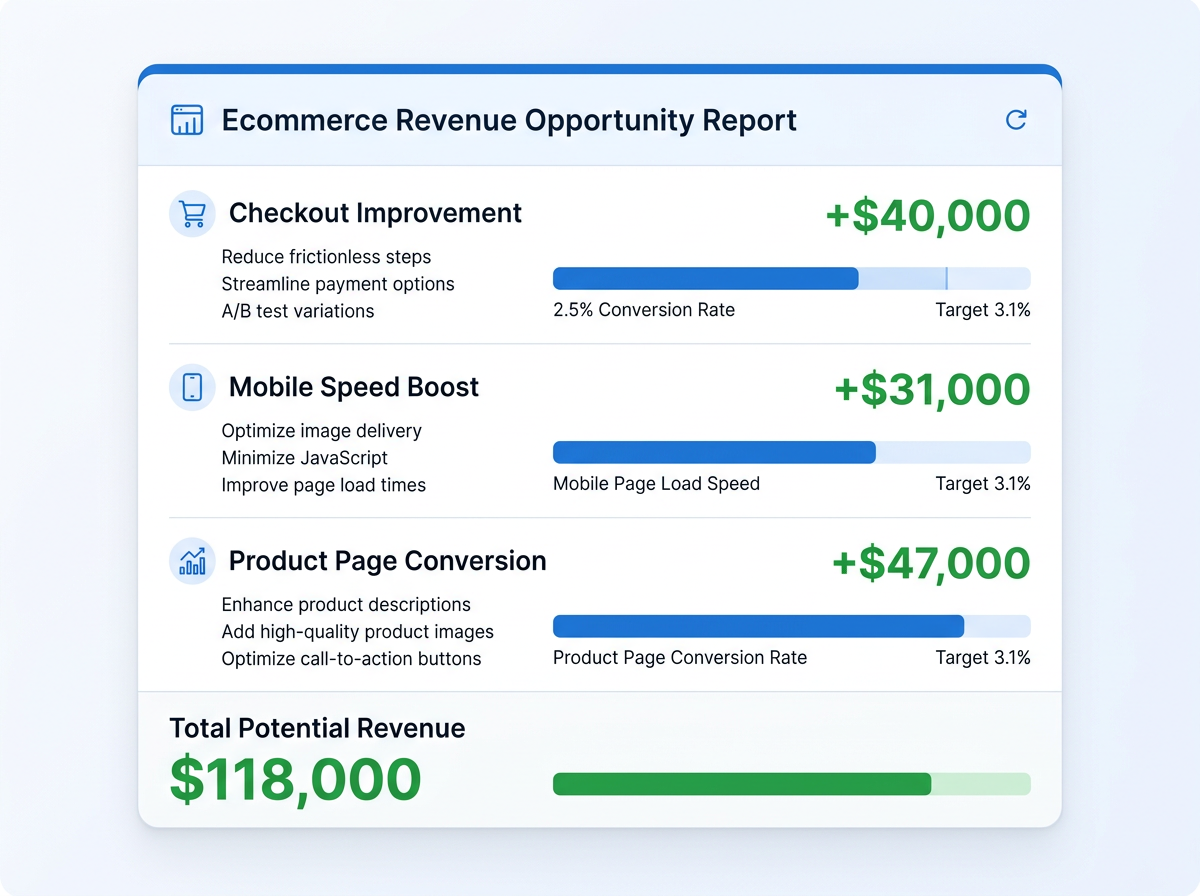
Example: $137,000 Annual Revenue Opportunity Identified

Here's how small conversion improvements compound on a $2M/year store — this is the kind of breakdown your report reveals.

2% checkout conversion improvement +$40,000
15% mobile speed boost +$31,000
Improved product page conversion +$47,000
Cart abandonment recovery +$19,000

This is revenue opportunity identified from your current traffic — not additional ad spend. Before you spend more to get traffic, find out how much your store is already failing to capture.

Revenue opportunity breakdown report mockup

How Your Revenue Score Works

Submit Your Store

Share your Shopify store URL and a few basic details. Takes about two minutes.

We Analyze Everything

Our team scores your store across all 12 revenue drivers using our scoring framework. We do the work.

Get Your Report

Receive your personalized Revenue Score™ with opportunity estimate and prioritized action plan — within 48 hours.

Get Your Free Ecommerce Revenue Score™

See exactly where your Shopify store is losing revenue and how much opportunity you're sitting on.

  • A personalized score across all 12 revenue drivers
  • An estimated annual revenue opportunity, in dollars
  • A prioritized action plan — what to fix first
  • Delivered within 48 hours

Your information is never shared. No spam, ever.

Your report will be delivered within 48 hours. No spam, no pitch — just clarity.

Frequently Asked Questions

Yes. There's no cost and no credit card required. We built this to demonstrate our methodology and, frankly, because most stores we look at have real, fixable revenue leaks worth surfacing.

A personalized report scoring your store across 12 revenue drivers, an estimated annual revenue opportunity in dollars, and a prioritized list of what to fix first — delivered as a PDF within 48 hours.

Most audits give you a generic checklist. Ours quantifies the dollar impact of each issue and ranks them by leverage, so you know exactly what to fix first instead of guessing where to start.

You'll receive your report regardless. If you'd like help implementing the fixes, we'll mention that as an option — but there's zero obligation and no pressure either way.

If your store does under $10K/month, the revenue opportunity may not yet be large enough to justify prioritizing fixes. This is built for operators with meaningful traffic and sales volume already in place.

Your report is delivered within 48 hours of submission. We move fast because clarity loses value the longer it takes to reach you.

No. We analyze your storefront and public-facing experience only — no login credentials, backend access, or app installs required.

Before You Spend More on Traffic, Find Out What You're Already Losing

Every month without this clarity means continued revenue leakage from the traffic you already have. Get clarity on your highest-leverage opportunities first.

"I wish I'd done this a year ago — we were bleeding revenue every single month and had no idea."
— Sarah Chen, Founder, Marrow & Co.
Get My Free Revenue Score

Free analysis. No commitment. Clear priorities.